SHIB Price Prediction: How High Can the Meme Coin Go in Current Market Conditions?

#SHIB
- Technical Setup: Oversold conditions with bullish MACD divergence suggest rebound potential
- Market Sentiment: Mixed due to meme coin rotation but supported by SHIB's strong community
- Key Levels: 0.00001128 support and 0.00001311 resistance will determine near-term direction
SHIB Price Prediction
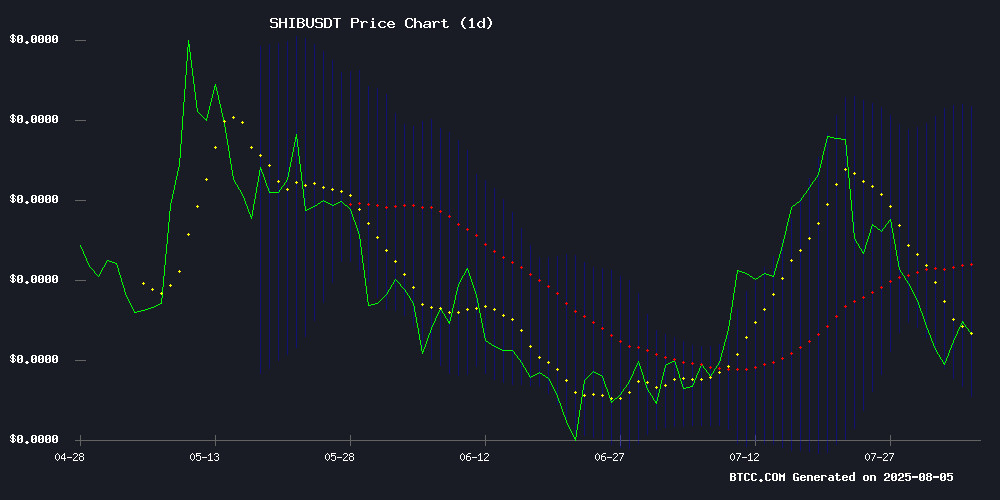
SHIB Technical Analysis: Key Indicators Signal Potential Rebound
SHIB is currently trading at 0.00001216 USDT, below its 20-day moving average of 0.00001364, indicating short-term bearish pressure. However, the MACD shows a bullish crossover with the histogram at 0.00000104, suggesting growing upward momentum. Bollinger Bands reveal SHIB is testing the lower band at 0.00001128, which often acts as support. 'The convergence of these indicators suggests SHIB may be oversold,' says BTCC analyst Olivia. 'A rebound toward the middle Bollinger Band at 0.00001364 appears likely if current support holds.'
Market Sentiment Mixed as SHIB Tests Critical Levels
While SHIB faces volatility amid competition from other meme coins, its 5th anniversary celebration and current technical setup create conflicting sentiment. 'The resistance at 0.00001311 remains key,' notes Olivia. 'News FLOW shows investors are rotating between meme assets, but SHIB's established community could help it outperform during rebounds.' The current test of support coincides with increased network activity, potentially setting the stage for a turnaround.
Factors Influencing SHIB's Price
Shiba Inu Tests Key Support as Investors Flock to Maxi Doge Amid Meme Coin Volatility
Shiba Inu's 25% retreat from its two-month high of $0.00001598 has left traders questioning whether Sunday's bounce from $0.000012 marks a true reversal or temporary respite. The second-largest meme coin now shows technical weakness despite some analysts spotting potential basing patterns for another leg up.
Market confusion intensifies as SHIB's volatility contrasts with Maxi Doge's surprising resilience. This emerging competitor continues attracting capital even as the broader meme sector cools—a divergence highlighting the speculative nature of altcoin rotations.
CoinMarketCap data reveals SHIB's 11% weekly decline to $0.0000121, testing a critical support zone that previously sparked rallies. The price action mirrors meme coins' characteristic boom-bust cycles, where sudden surges often meet equally sharp retracements.
Shiba Inu Price Attempts Rebound, Faces Key Resistance at $0.00001311
Shiba Inu shows tentative signs of recovery, edging up 1.09% to $0.00001239 after hitting a July low of $0.00001138. The meme coin remains 8.2% down weekly, reflecting persistent market caution despite the minor uptick.
Technical indicators suggest a potential inflection point. The RSI has climbed from 38 to 47.19, though still below the neutral threshold. Bollinger Band contraction signals dwindling volatility, often preceding decisive moves. Critical resistance awaits at the 50-day EMA of $0.00001311—a level that could determine whether this rebound gains traction.
All eyes turn to tomorrow's Shibarium governance vote, a catalyst that may override technical factors. With $7.3B in market cap and equivalent daily volume, SHIB's next move could ripple through the meme coin sector.
SHIB Price Faces Critical Test at Support Levels After 5th Anniversary Celebration
Shiba Inu's price action hangs in the balance as technical indicators flash mixed signals during its fifth anniversary week. The meme coin trades near lower Bollinger Band support at $0.00001298, with its RSI hovering at 40.87 - neither oversold nor convincingly bullish. Market participants note the irony of this technical crossroads coinciding with celebrations of SHIB's 21,600,000% historical gains since August 2020.
July's 30% rally, fueled by AI integration progress and transaction volume spikes, now confronts August's characteristic volatility. Resistance at $0.000016 stands as the next psychological barrier, while the MACD's negative histogram suggests bears haven't relinquished control. Traders await either a confirmation of July's momentum or a typical late-summer consolidation phase.
How High Will SHIB Price Go?
Based on current technicals and market conditions, SHIB could potentially rally to the following levels:
| Target | Price (USDT) | Key Factor |
|---|---|---|
| Near-term | 0.00001311 | 20-day MA & Bollinger Middle Band |
| Medium-term | 0.00001600 | Upper Bollinger Band |
| Bull Case | 0.00001850+ | Previous resistance zones |
'The 0.00001128 support must hold for these targets to remain valid,' cautions Olivia. 'Meme coin volatility means traders should watch Bitcoin's momentum and overall crypto market liquidity.'
1
